How to localize issue with Binary Search Approach
On this page
Overview
Production Reality: When 1,000,000 Users Becomes 100
One of the most expensive debugging failures in backend engineering is not a bad algorithm. It is a bad localization strategy. I worked on an enterprise monolithic Spring application that had a hard capacity target: support 1,000,000 concurrent users. The application consistently failed around 100 concurrent users, including the login endpoint. That number matters. If your login path fails at 100, business logic is rarely your primary bottleneck.
For six months the team executed every standard optimization program. We tuned Redis behavior and cache policies, optimized SQL, removed N+1 paths, tuned connection pools, adjusted proxy connections, modified AWS architecture, improved algorithms, and mined logs for suspicious patterns. We were active, disciplined, and still wrong. The throughput ceiling did not move in any meaningful way.
That was the inflection point. We stopped asking, "What can we optimize next?" and started asking, "How do we localize the fault domain fast?" The answer was a binary search approach to debugging. Instead of tuning one hypothesis at a time, we began cutting the problem space in half repeatedly, then testing under the exact same load profile.
What Binary Search Debugging Means in Practice
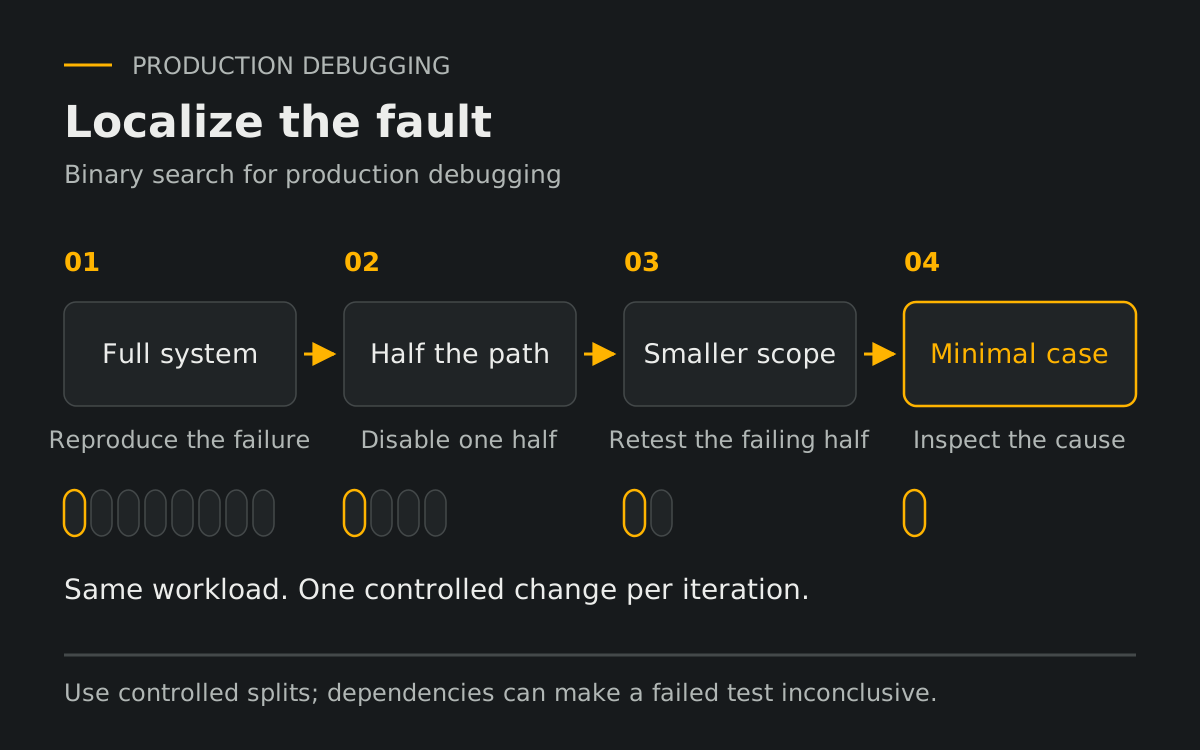
Binary search debugging borrows the divide-and-test strategy from binary search. Start with the full system. Disable roughly half of the active path, then repeat the same test. If the symptom persists, focus the next experiment on the remaining path. Check that each split preserves the relevant dependencies and workload: a changed test can produce a misleading result. Continue until you have a minimal reproducible case.
In our case, we progressively removed major slices of the monolith. Then we removed more. Then more. The iterations were not pretty, but they were fast and measurable: 50%, 25%, 12.5%, and so on. We eventually reduced the runtime path to a trivial endpoint:
@RestController
public class TestController {

    @GetMapping("/test")
    public boolean test() {
        return true;
    }
}
Even this minimal version still failed around 100 concurrent users. At that point, the conclusion was explicit: the issue was not business logic. No amount of domain-level optimization can rescue a system when the underlying lifecycle behavior is broken.
Why Teams Default to Linear Debugging
Most teams debug linearly because linear debugging feels productive. You pick a subsystem, tune it, and show progress. But linear exploration of a large hypothesis space is O(n). If your issue could be in framework defaults, DB lifecycle, pool saturation, thread scheduling, proxy behavior, JVM settings, or code paths, linear debugging burns calendar time quickly. Binary debugging is O(log n). It is not a style preference; it is a search efficiency strategy.
Senior teams should care about this because MTTR is not only about tooling. It is about choosing the right search function. A great observability stack cannot compensate for an inefficient investigative method.
Technical Breakdown
The Baseline Comparison That Broke the Stalemate
After proving the monolith could fail with almost no business code, we created a clean Spring application from scratch. Same endpoint contract. Same load generator. Same test envelope. The new baseline handled more than 1,000,000 concurrent users. That result changed the conversation immediately. The platform was capable. The inherited application behavior was not.
Root cause analysis converged on one configuration:
spring.jpa.open-in-view=trueOpenSessionInView was enabled. Under heavy concurrency, session retention extended persistence lifecycle across the web request scope, increasing pressure on connection management and contributing to exhaustion behavior. The fix was simple:
spring.jpa.open-in-view=falseAfter disabling it, the system scaled correctly. Six months of broad optimization failed to produce what one focused localization strategy exposed in a short cycle.
The Binary Search Framework for Debugging
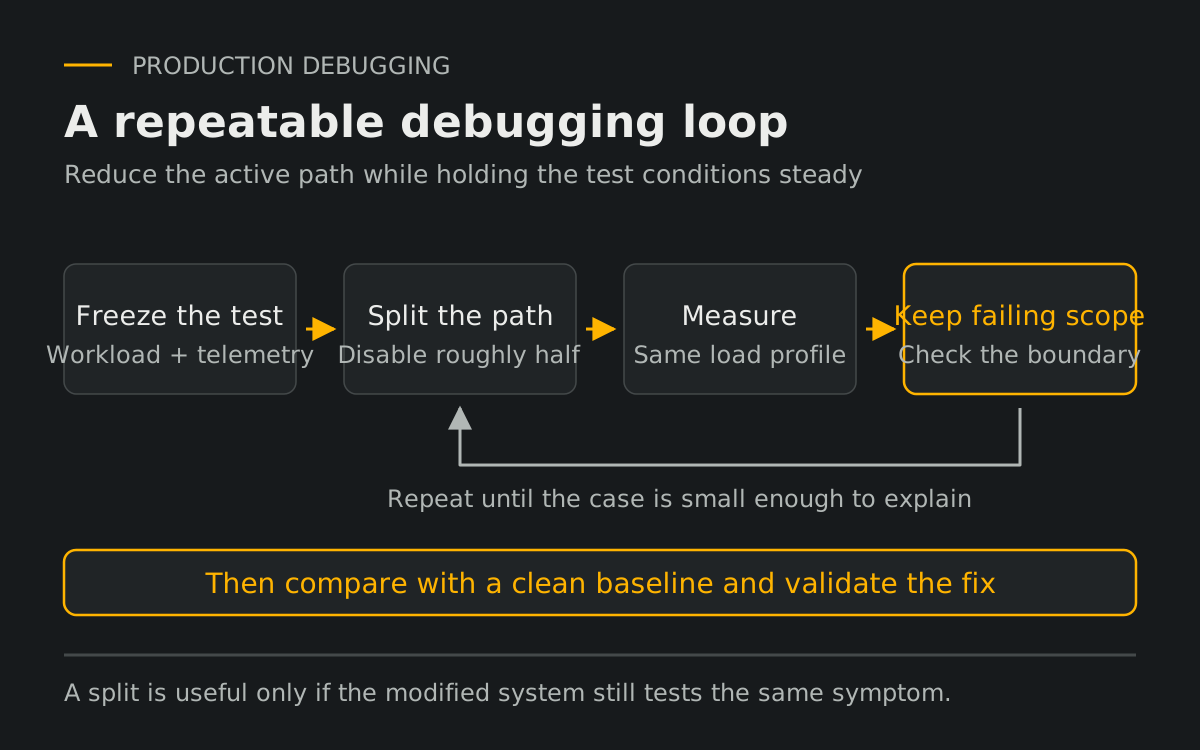
Step 1: Isolate. Freeze one reproducible test scenario. Same workload, same assertions, same telemetry. If the test changes every run, results are noise.
Step 2: Split. Disable approximately 50% of the active path. Choose boundaries that are architecture-aware: controller vs service, sync vs async, read vs write, integration set A vs B.
Step 3: Measure. Capture throughput, p95/p99 latency, error class, connection pool pressure, thread state, and queue depth. "Felt better" is not a metric.
Step 4: Narrow the scope. If the same failure persists, investigate the active half next. Treat the result as evidence, and check whether the split changed dependencies or introduced another failure.
Step 5: Repeat. Continue halving until you reach a minimal reproducible version that can be reasoned about directly.
Step 6: Compare with a clean baseline. A fresh baseline differentiates framework limits from project-specific configuration debt.
SQL Example: Localize the Expensive Segment
Binary search works at query level as well. Start from the full query:
SELECT *
FROM orders o
JOIN users u ON o.user_id = u.id
JOIN payments p ON p.order_id = o.id
WHERE ...
GROUP BY ...
HAVING ...
If this path is slow, comment out roughly half of the joins and re-run with identical parameters and execution-plan capture. Keep the half that preserves the slowdown. Repeat until one join, one predicate family, or one grouping shape is clearly dominant. After localization, choose targeted mitigation: index strategy, pre-aggregation, decomposition, or query rewrite. Without localization, "query optimization" becomes random movement.
Microservices Example: Feature-Flag Half the Integrations
In distributed systems, bottlenecks hide in integration fan-out. Use feature flags to disable 50% of downstream calls for one endpoint during controlled load testing:
features:
  checkout:
    paymentGateway: true
    fraudCheck: true
    loyaltyService: true
    recommendations: true
Turn off two integrations, test, then keep the failing half. This beats collecting giant traces first and arguing over them later.
Key Takeaways
Why Infrastructure Scaling Hides Structural Faults
Adding servers is valid when the bottleneck is horizontal capacity. It does not fix lifecycle leaks, contention, blocking chains, or retention behavior. In many incidents, scaling increases cost and metric noise while preserving the same failure mode. If a minimal endpoint fails at low concurrency, your first move should be localization, not more hardware.
Why Minimal Reproducible Versions Are High-Leverage
Minimal reproducible versions collapse uncertainty. They reduce the causal surface area, expose hidden defaults, and make config diffing practical. They also improve communication across architecture, platform, and operations teams because evidence is concrete and compact. In escalation scenarios, a reproducible minimal case is often the fastest path to root cause validation.
Binary Search Is Universal
This method is not limited to Java or Spring. It works in code, architecture, system design, infrastructure debugging, incident response, and technical decision-making. The principle is universal: if you can split the uncertainty space in half and measure after each split, you can converge quickly.
It also applies outside production systems. When solving any complex problem, divide the problem space into halves and eliminate non-causal branches. This reduces cognitive load and prevents scope drift.
Complexity Math: O(n) vs O(log n)
With a deterministic test and independent, evenly divisible hypotheses, linear exploration takes O(n) tests while repeated halving takes O(log n). In that ideal case, 1,024 candidates narrow to one in 10 decisions. Real systems have interacting components, so validate the assumptions behind each split.
The practical benefit comes from reducing the scope of each investigation before spending time on a targeted fix.
Final Takeaway
The most meaningful performance improvements rarely come from bigger machines. They come from better decomposition. The team in this case did not lack effort. We lacked search efficiency until we changed the method. Once we switched to systematic halving, the root cause became visible, testable, and fixable.
If you can divide a problem in half, you can solve it.
Linear tuning often optimizes the wrong layer. Binary elimination finds the right layer first, then optimization starts to matter.